Introduction
As a financial institution dedicated to customer success, Bank of the West's call center receives many calls every month on a wide variety of reasons from customers with diverse demographics.
In order to ensure excellent support but also sustain efficiency, BOTW is interested in monitoring and understanding the trends in the call center data based on caller engagement, demographics, digital activity, and money movement.
Data Cleaning
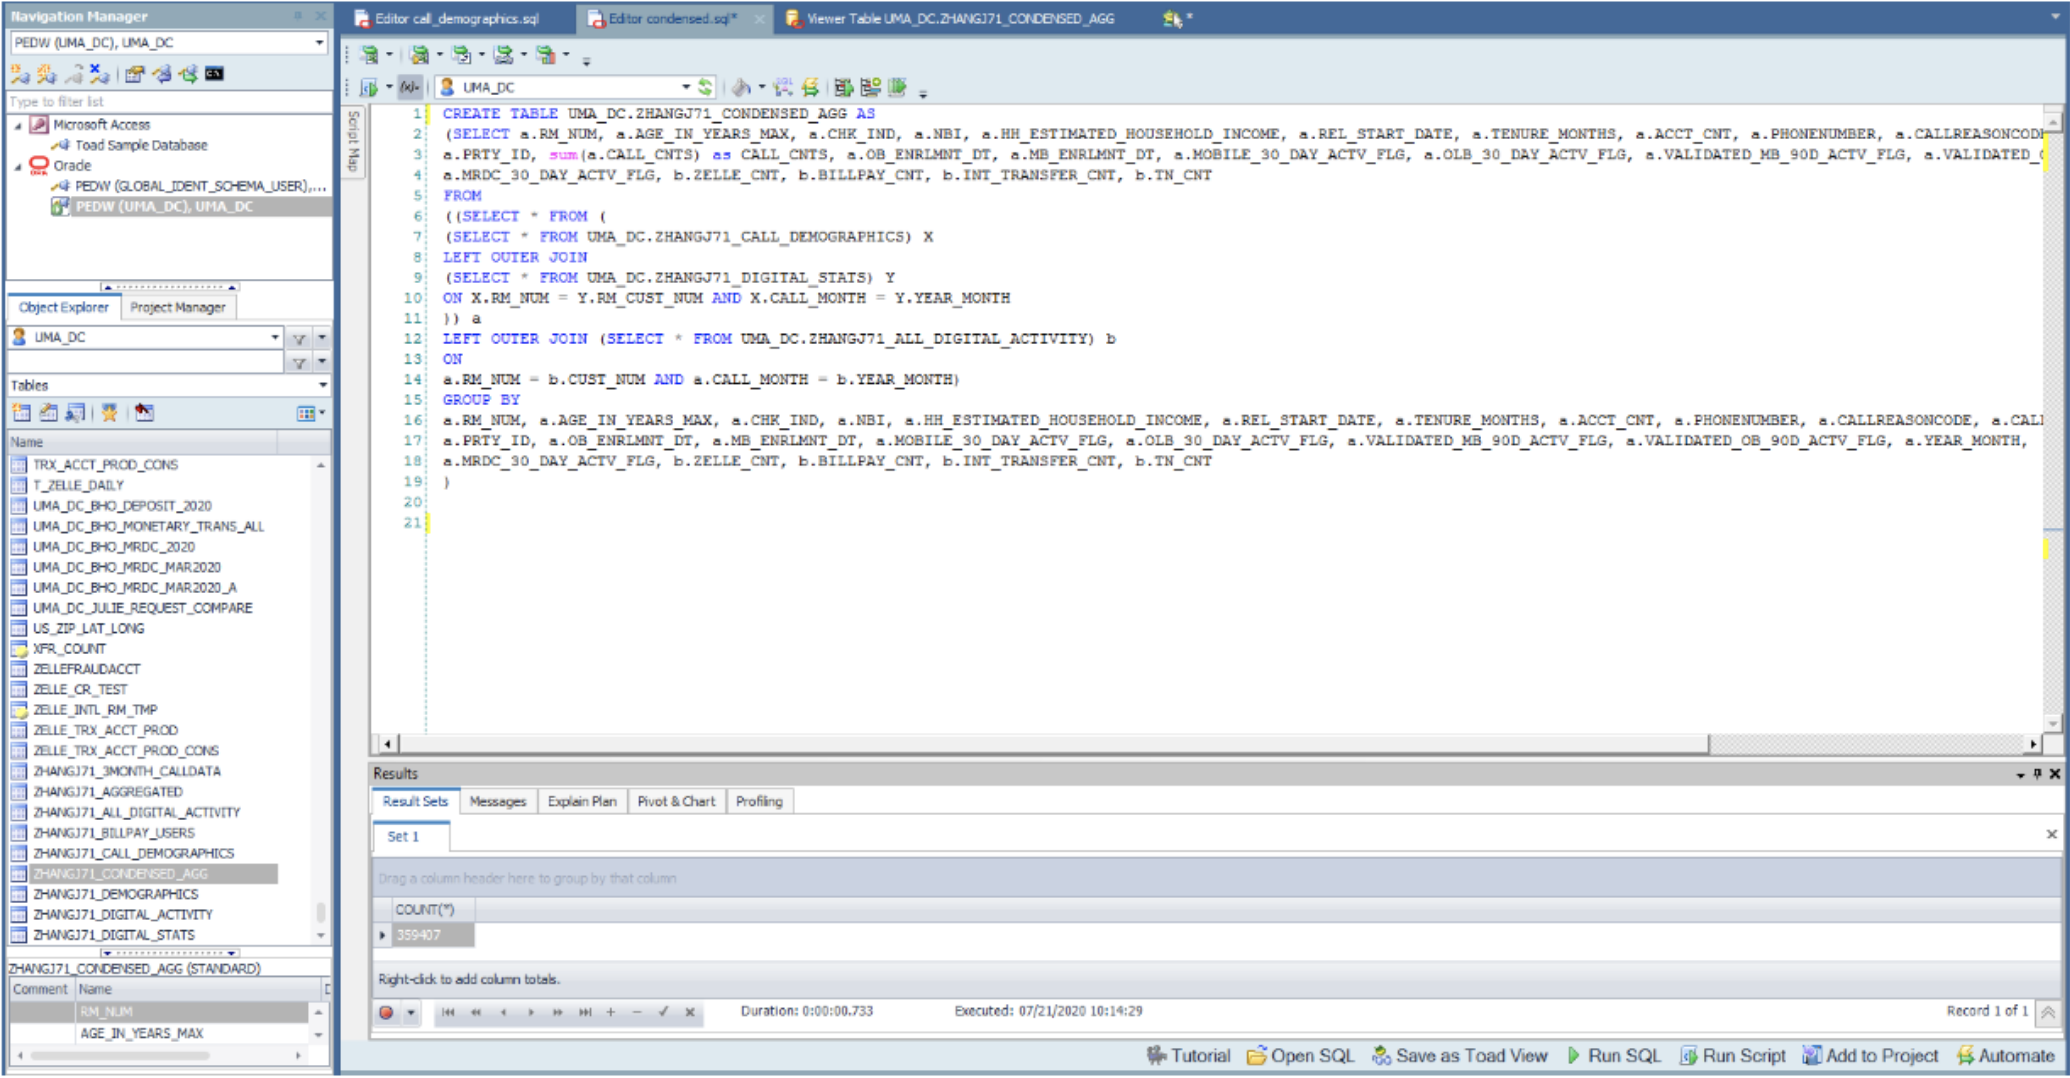
I utilized TOAD to write SQL statements so I could join the base tables together and ultimately get one table of all the information I was interested in.
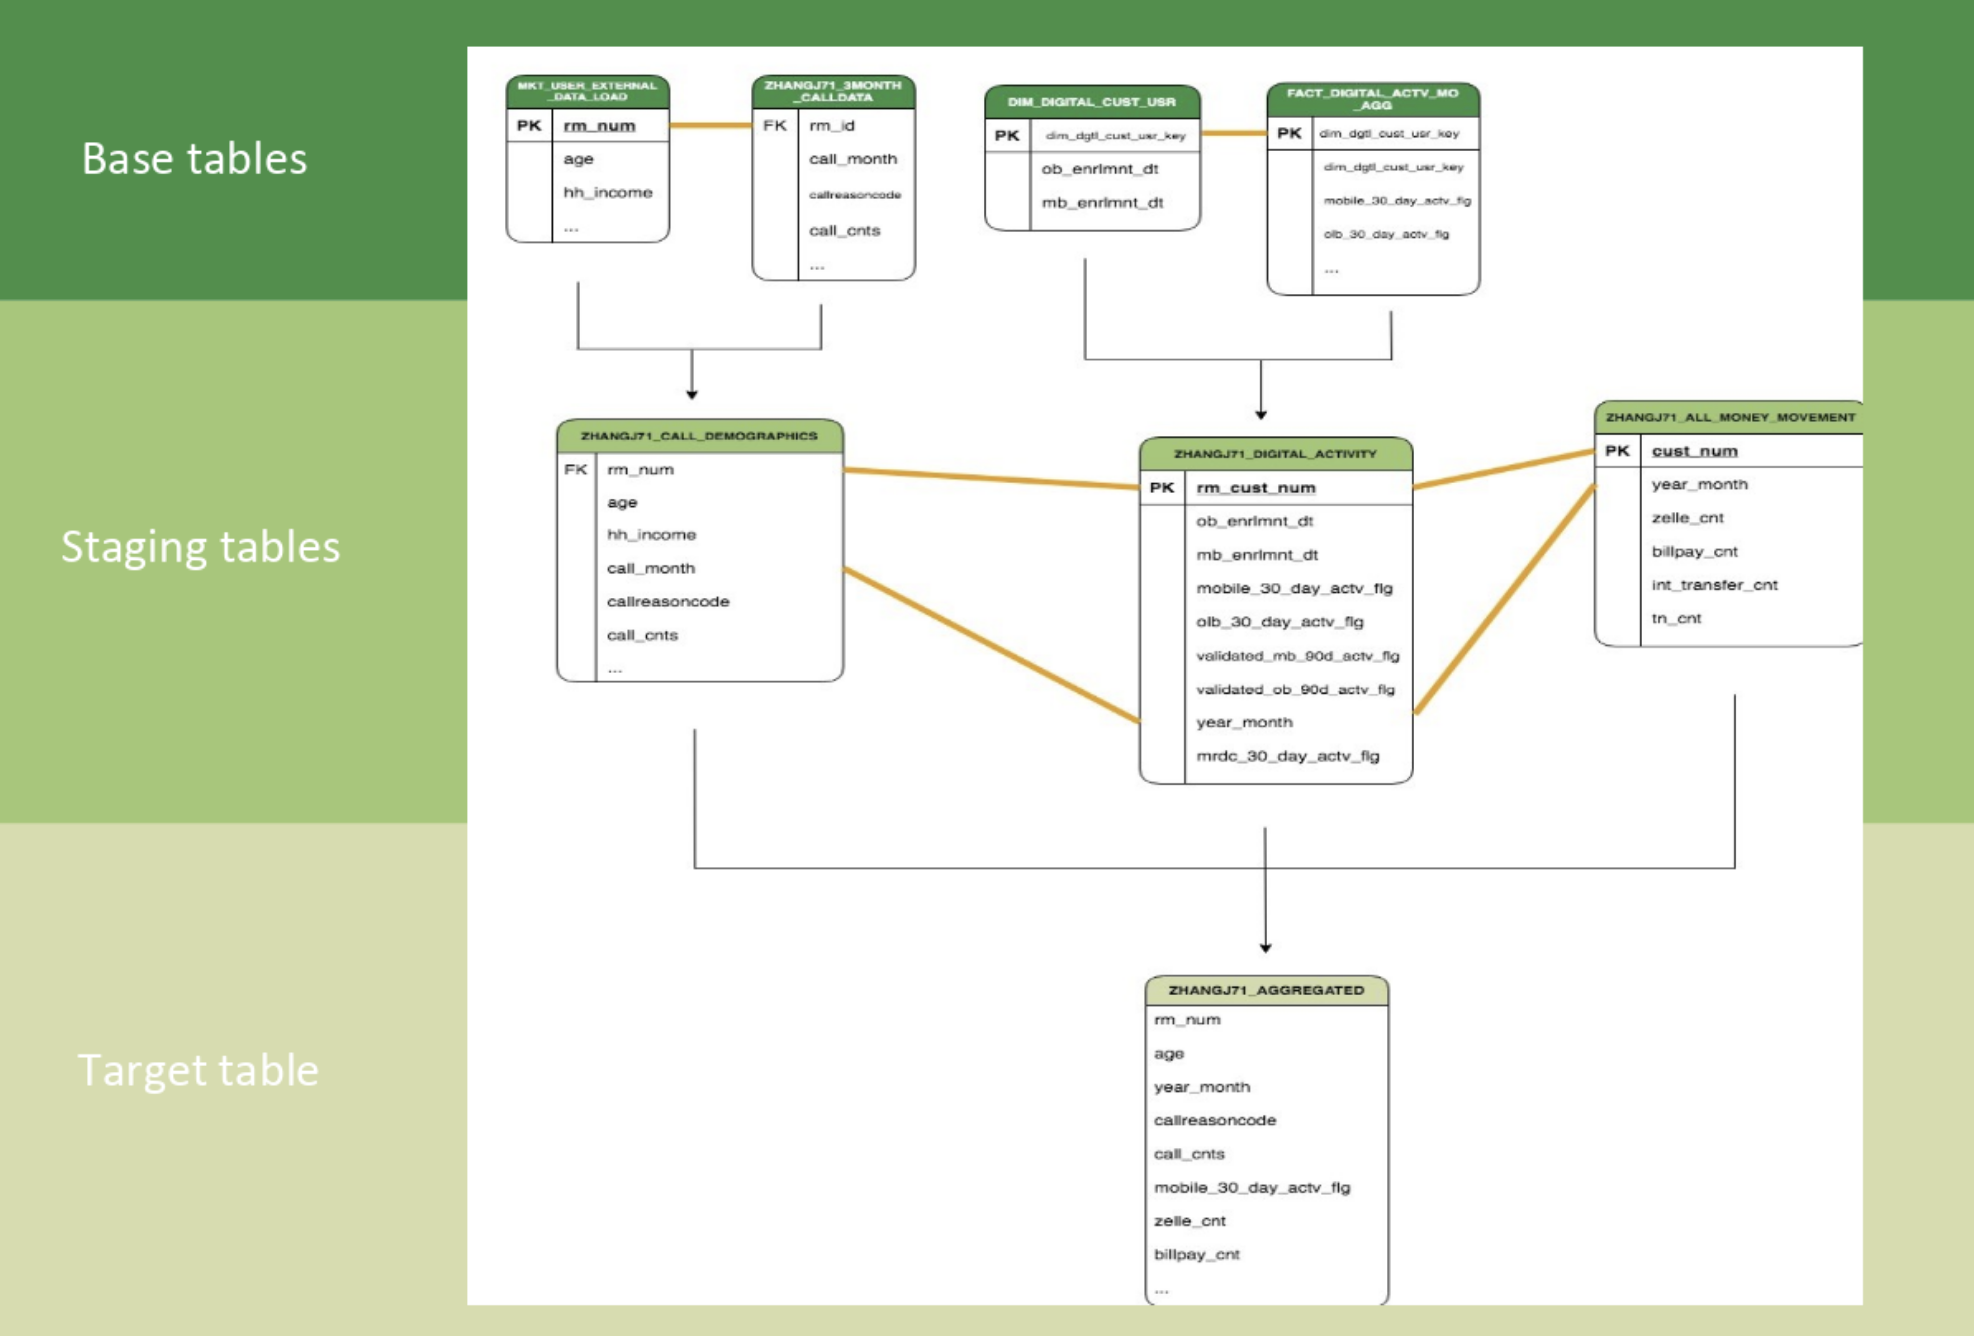
So here is just a basic workflow diagram of how I cleaned and manipulated the base tables to get my final target table. I first joined the external data load with the call center data so that I could get a table where each row represents one call with demographic data on the caller. Then I joined the digital cust usr table with the fact digital activity table to get a table with each customer and their digital activity of every month (when they enrolled in online banking, whether they were active in the last 30 days, etc). Lastly I gathered data regarding each customer and their money movement, basically creating a table documenting how many zelle payments, billpay payments, etc a customer made each month. To get the final target table, I joined the three staging tables together by rm_num and year_month.
Statistical Analysis
Statistical question: What factors influence customer calls about money movement?
Money movement refers to the system of cashless modes of payment. I specifically looked at Billpay, which is an older system that is mainly used to pay bills to a company, and Zelle, which is newer and used to send and receive money from individuals. I think going into any analysis, you tend to have many presumptions about what the data will look like. For example: who would you expect to call more, older customers or younger customers? And, as an individual makes more transactions, do you think they would call more times or less?
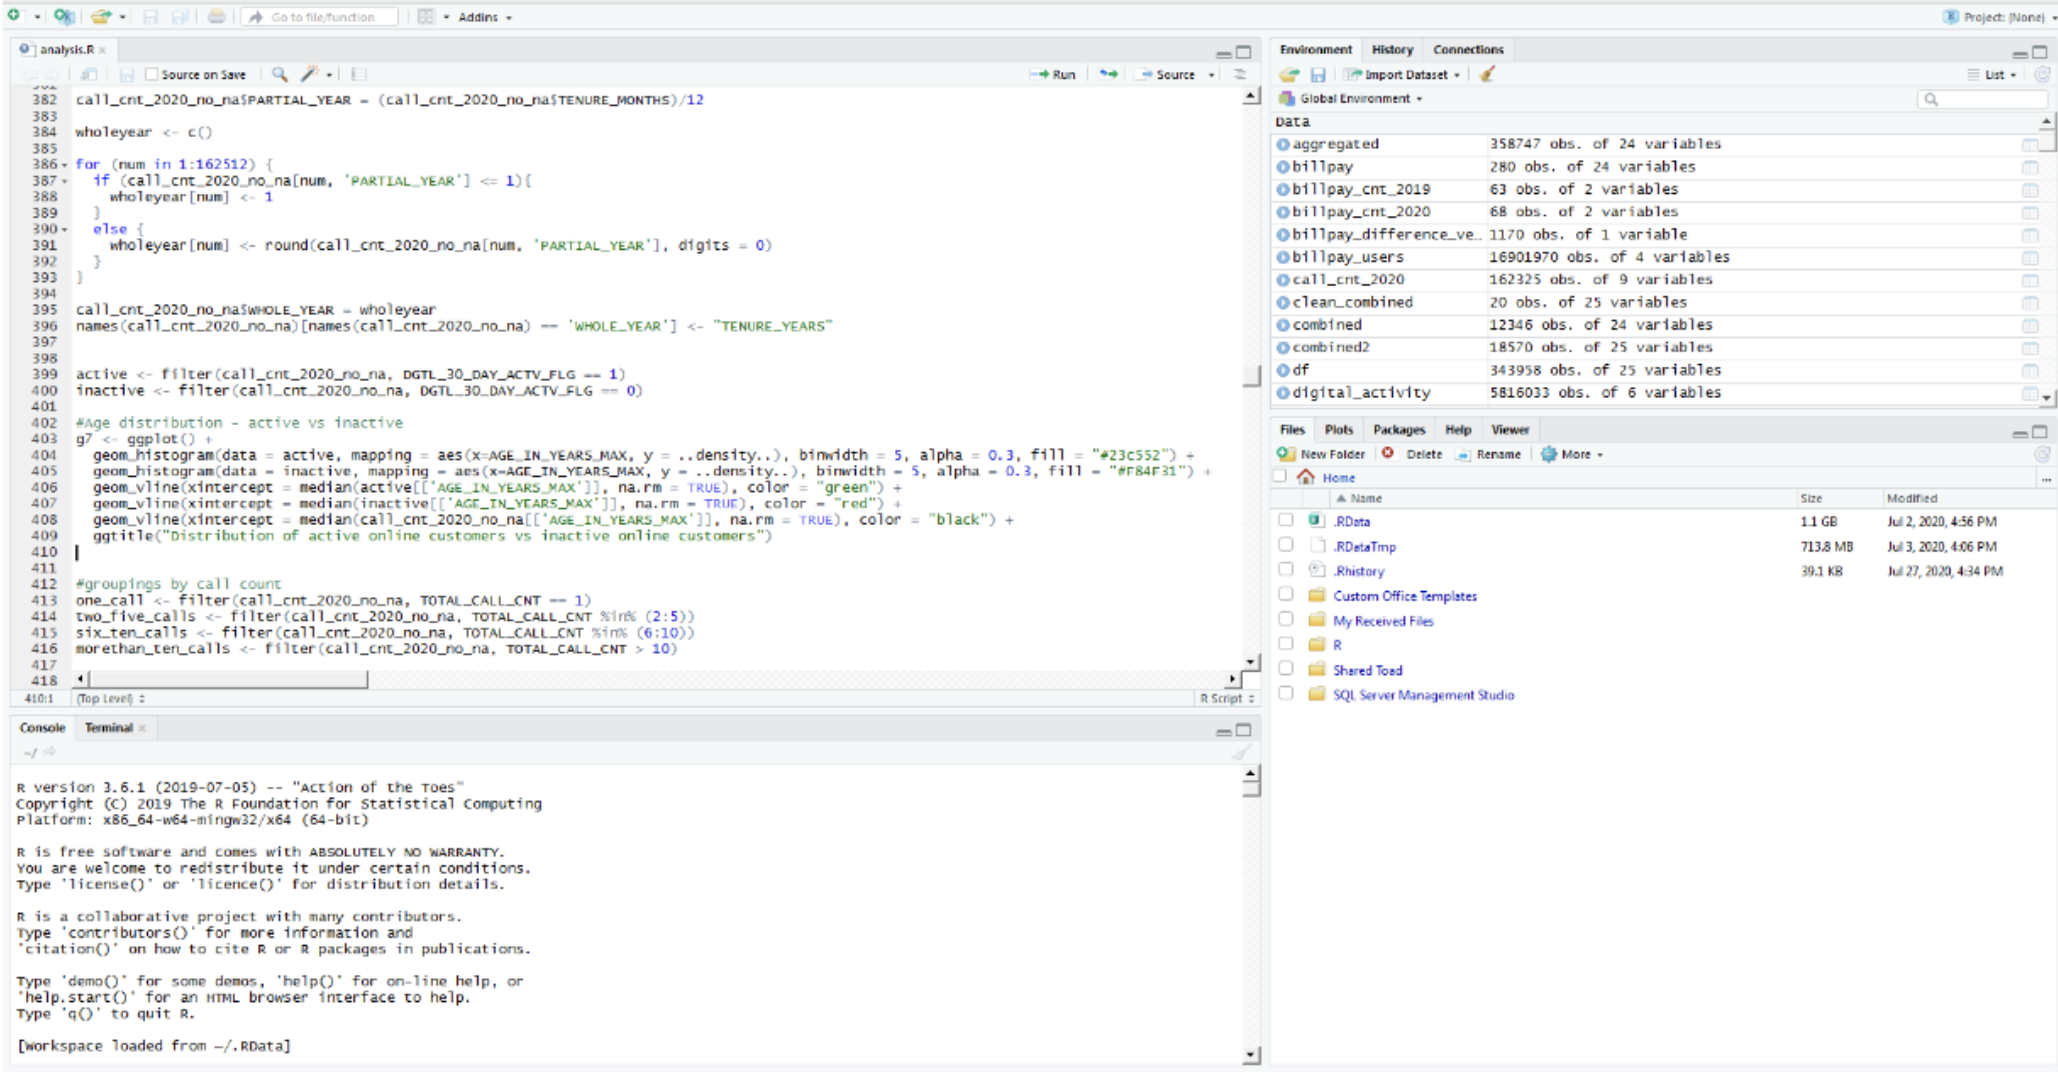
For statistical analysis and visualizations, I decided to utilize RStudio because it has a lot of the basic statistical tests built into the application already.
So first, I wanted to establish a baseline I could use to compare my findings to. I decided to look at the population of users of each system since a big proportion of money movement callers would be a subset of money movement users.
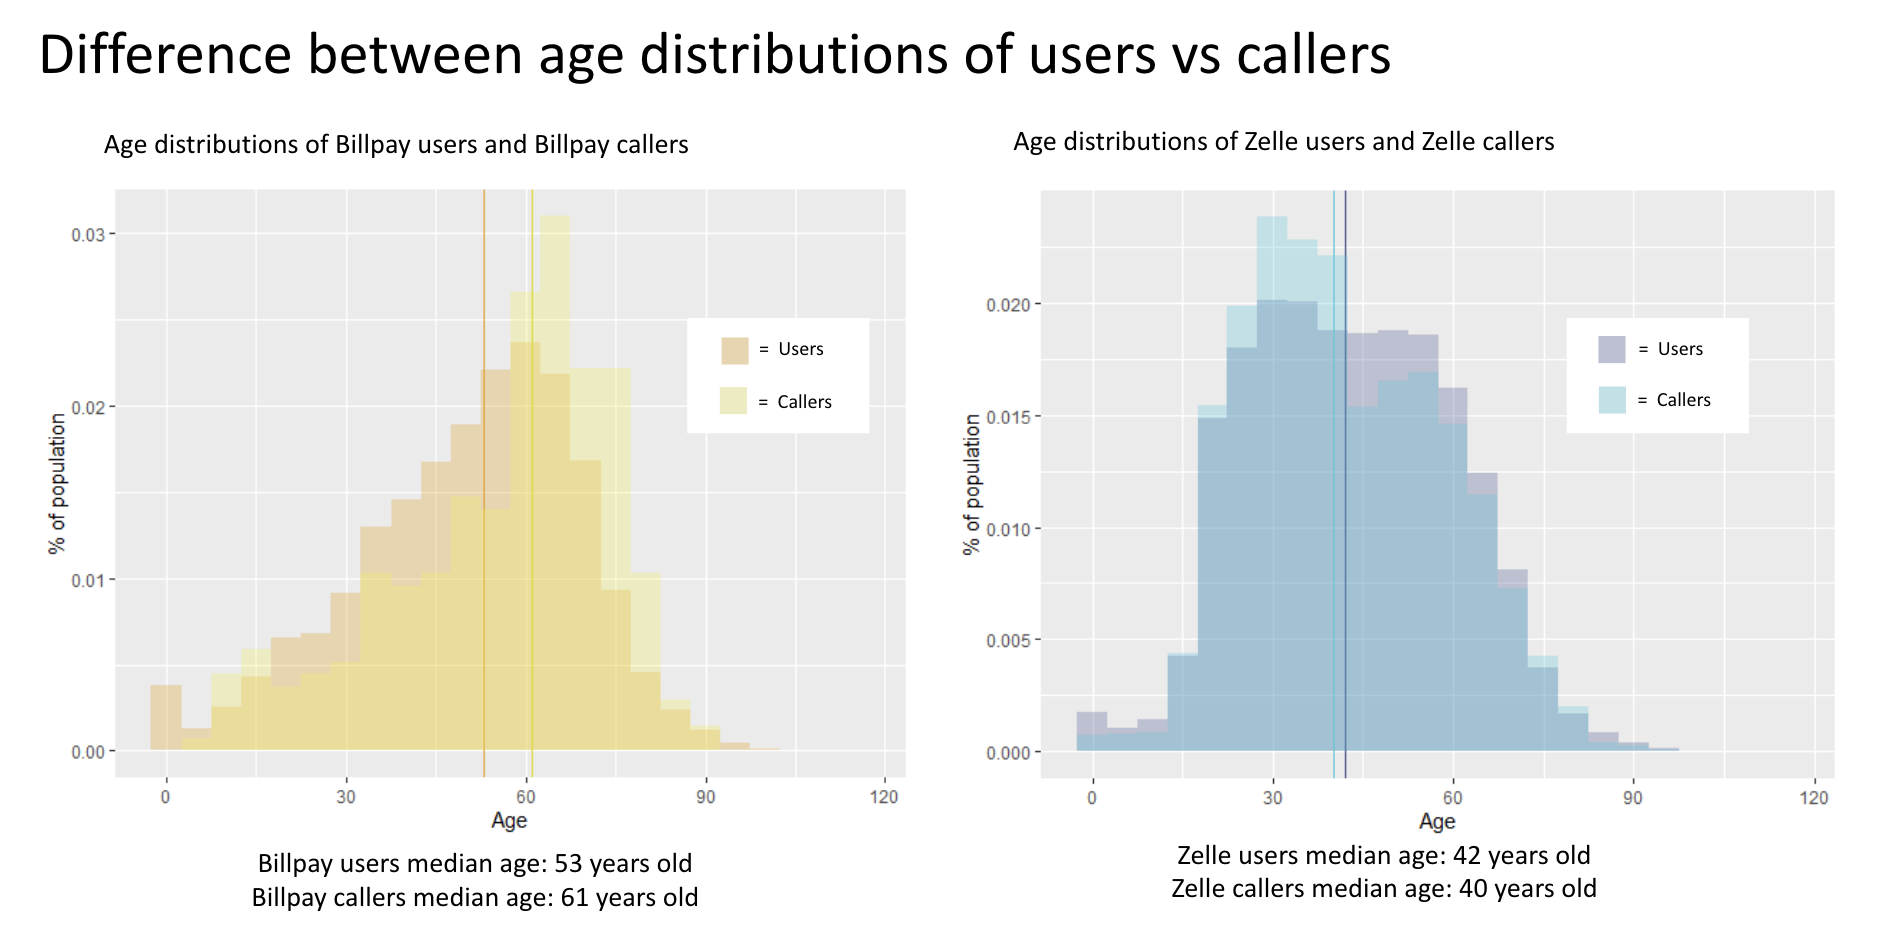
On the left, we have the age distribution of Billpay users and Billpay callers. The user distribution is slightly left skewed while the caller distribution becomes more skewed causing the median to increase from 53 years old to 61 years old. This implies that Billpay callers are significantly older than the average Billpay user.
On the right we have the age distribution of Zelle users and Zelle callers. The user distribution is much more normally distributed while the caller distribution starts to skew to the right causing the median to decrease from 42 years old to 40 years old. Although the difference is not that big, the fact that callers were younger than users was very interesting.
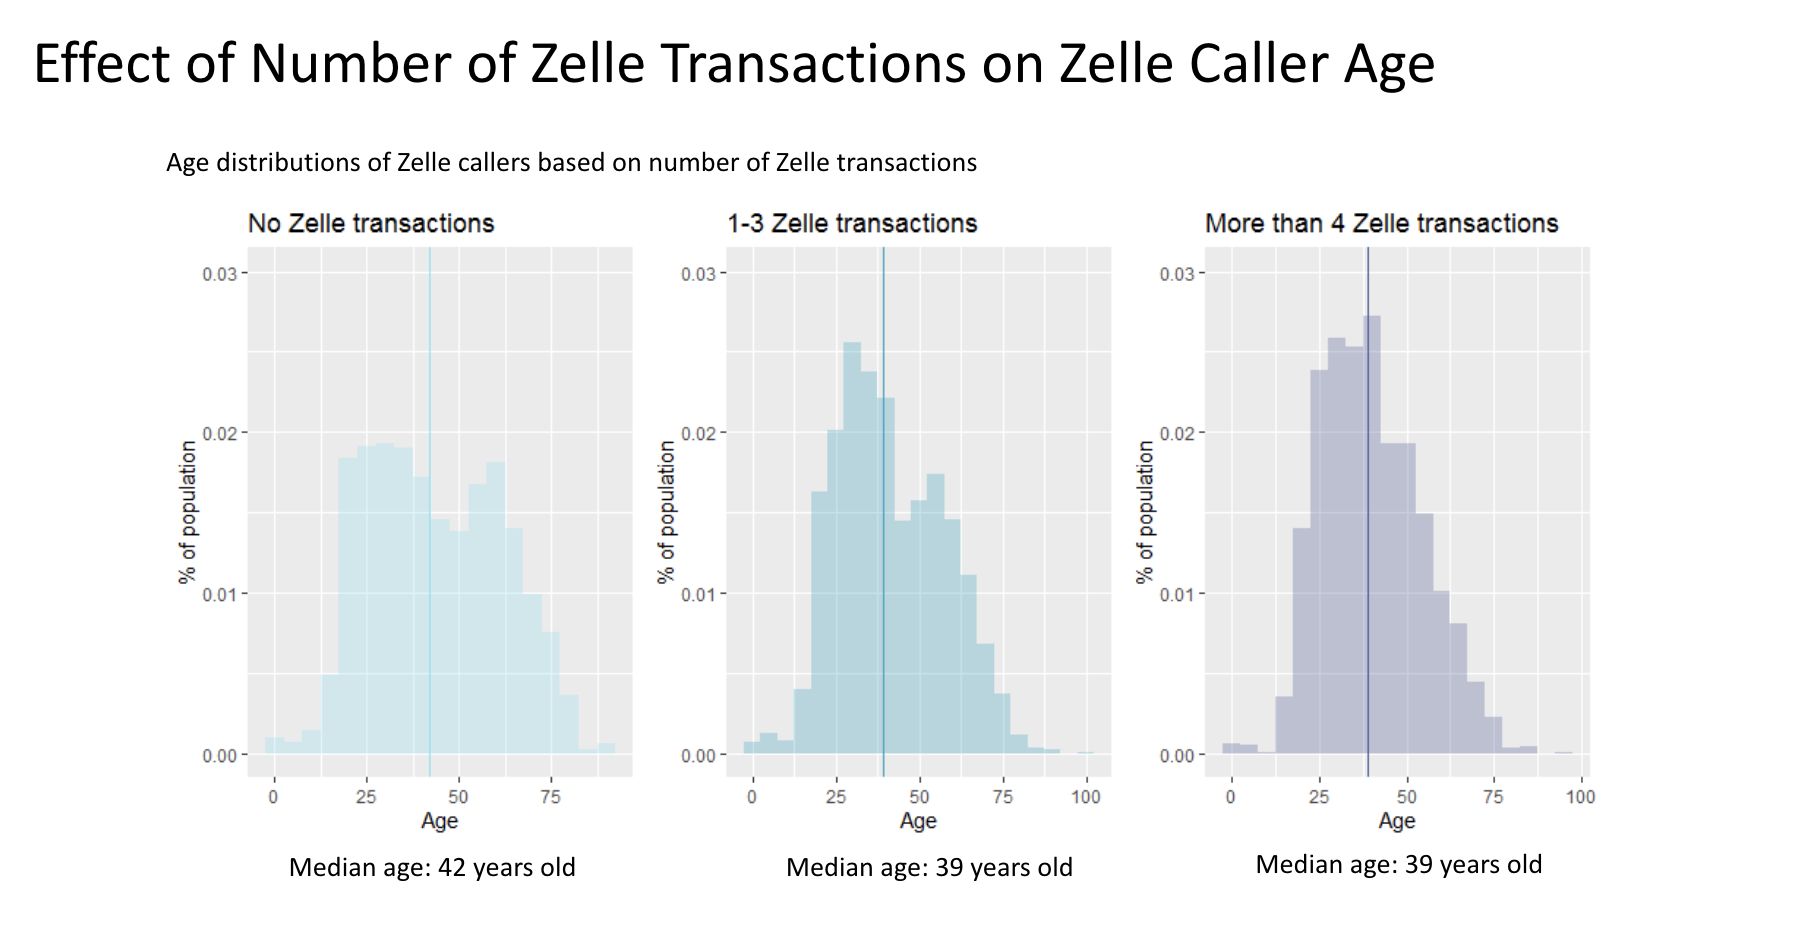
To further explore why younger customers were calling about Zelle, I subset the caller data into 3 groups: callers that made no zelle transactions, callers that made 1-3 zelle transactions and callers that made more than 4 zelle transactions.
With this split you can see the distribution starts off quite normally distributed but as callers make more transactions, the graph starts to skew to the right, resembling more and more like the overall age distribution of zelle callers.
The median age shifts from 42 years old to 39 years old to 39 years old and the number of outliers increases.
This shows that the number of zelle transactions plays a significant role in the skewing of the age distribution.
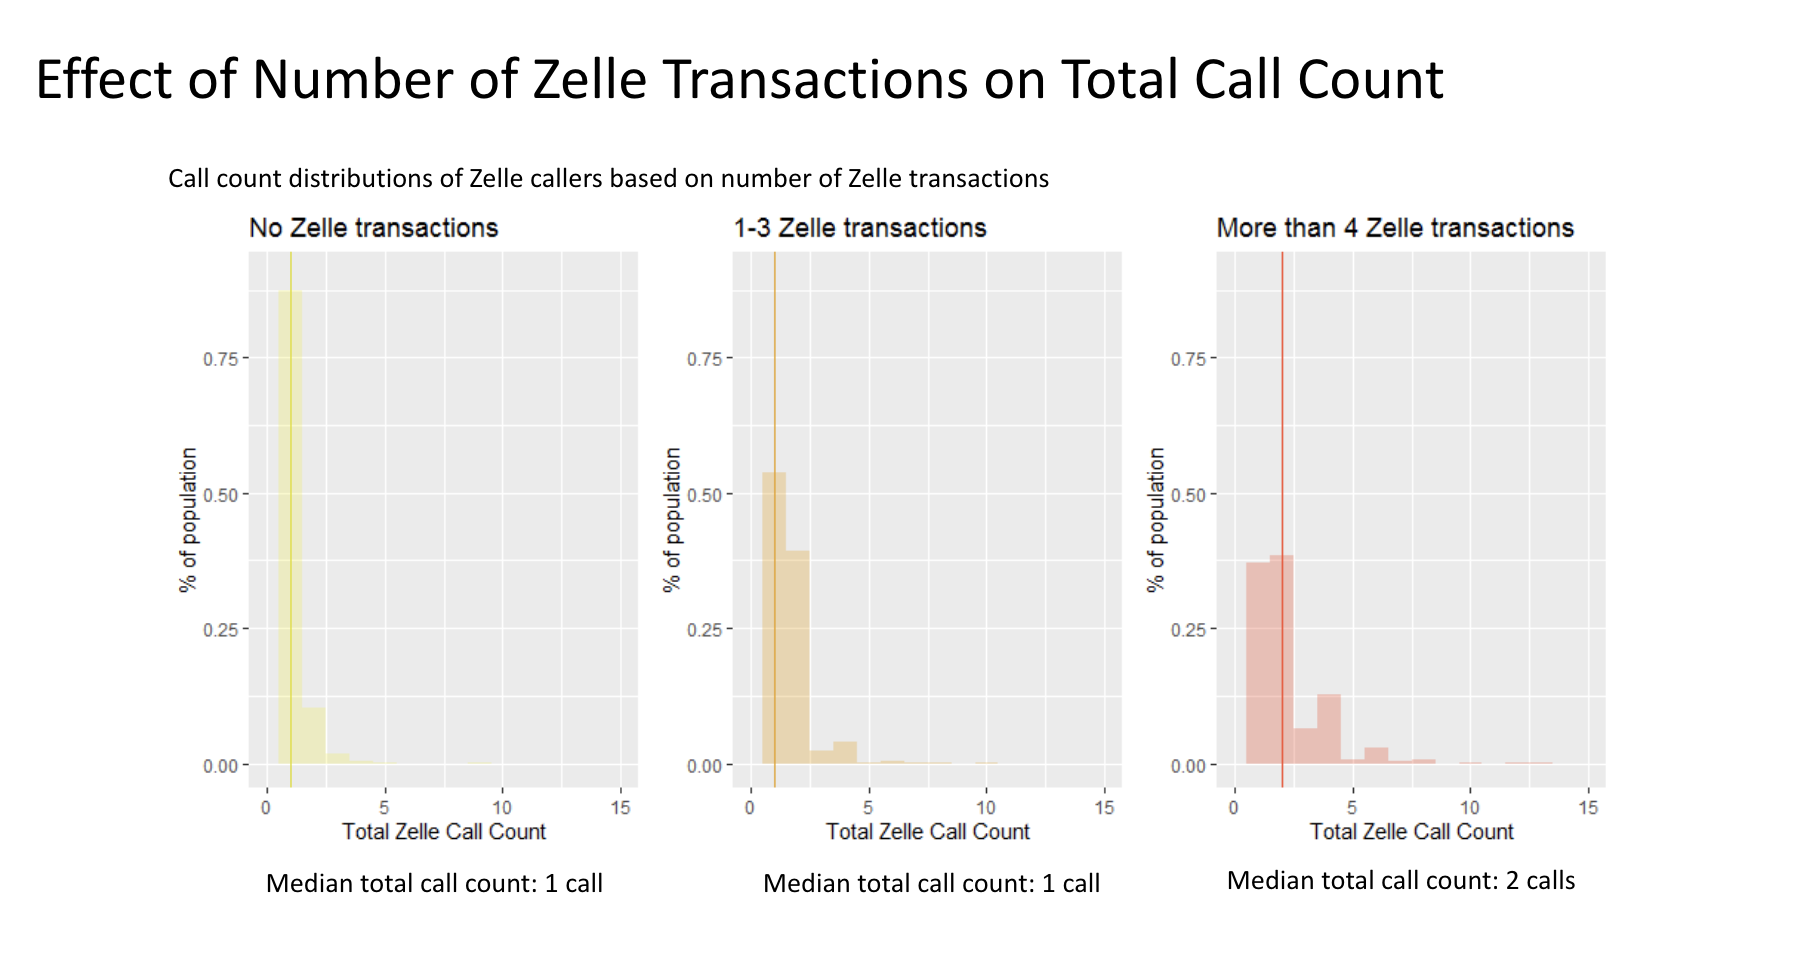
With this new information, I wanted to understand the relationship between the number of zelle transactions and the number of calls a customer would make about zelle. This would give us more insight on call quantity instead of just a mere indicator of whether they called or not.
From the graphs you can see that for those who made no zelle transactions, a high proportion of them only call once, but as the customer makes more and more transactions, the distribution fans out towards higher call counts.
The median total call count shifts from 1 call, to 1 call to 2 calls.
Although the shift isn’t super big, we can still see that as customers make more zelle transactions, the number of times they call increases.
What I Learned
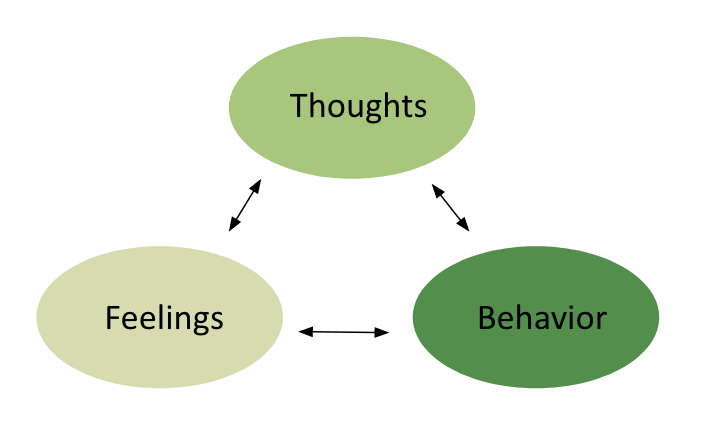
Through this project, I learned that in order to fully understand user-focused data, you have to look at all aspects of the cognitive triangle: thoughts, feelings and behavior. In my project, I’ve uncovered behavioral insights on the data and can describe behaviors users are portraying but I don’t know why or what drives this behavior.
Next Steps
Why are people calling more when they make more transactions? And why are they younger? Some next steps could be to look at survey callers and directly ask to understand their thoughts. We could also try looking into click data to see if there is a place on the webpage where people are getting stuck. We could also change up the design of the interface and try some A/B testing to see if the number of calls fluctuates.